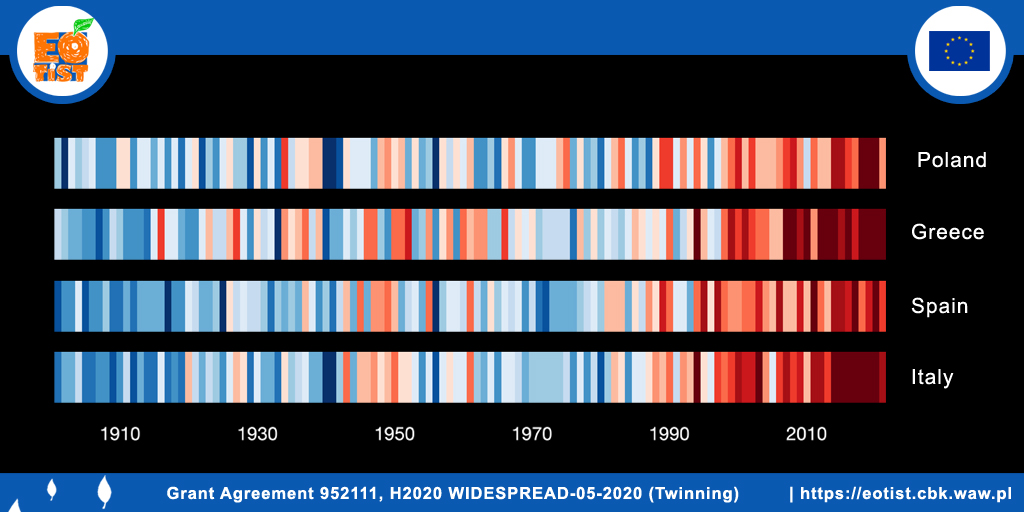
EOTiST project participated in worldwide action by preparation of figure with „warming stripes”. It is a visual presentation of temperature changes in countries of our consortium members. Each stripe represents one year. Blue indicates decrease and red indicates the increase of the mean temperature.
If you want join the action and generate the stripes for your area of interest – visit the website prepared by University of Reading: https://showyourstripes.info/.